

Shopify has introduced new web performance reports for all stores on the platform. This gives merchants unparalleled access to real user metrics (RUM) to help identify and fix performance bottlenecks in a way that's never been available before.
Here we'll provide you six custom dashboards that show the real power of the new reports, dashboards you're welcome to save and use in your own stores.
How to get started Jump to heading
You can access these dashboards through your Shopify admin via Analytics > Reports or through Online Store > Themes by clicking the banner at the top of the page. There's also comprehensive documentation if needed.
As a starting point, let's look at the "Largest Contentful Paint (LCP): Over Time" default graph. By default it's going to look something like this:

Customized dashboards Jump to heading
Out of the box you get a few defaults like the one above, but the beauty of this system is that you can customize things to fit your specific needs. Below are some custom reports that help us identify issues quickly and put us on the right path for finding solutions.
For reference, we'll share the ShopifyQL queries generated for these examples, which you can copy and save to your own dashboard.
Dashboard 1: High level overview Jump to heading
To start, we'll create a high level overview of the performance of our key page types. This allows us to keep an eye on our core metrics to gauge the overall health of our site. We recommend checking it daily and if you see a number here that is not green, it's time to start digging deeper with Dashboard 2 below.
Note: In a future update, you'll be able to save this to your report homepage for easy reference.
FROM web_performance
  SHOW percent_of_page_loads, lcp_p75_ms, lcp_distribution, p75_cls,
    cls_distribution, inp_p75_ms, inp_distribution
  WHERE device_type IS NOT NULL AND page_type IN ('product', 'index',
    'collection')
  GROUP BY device_type, page_type WITH TOTALS
  SINCE startOfDay(-30d) UNTIL endOfDay(-1d)
  ORDER BY device_type ASC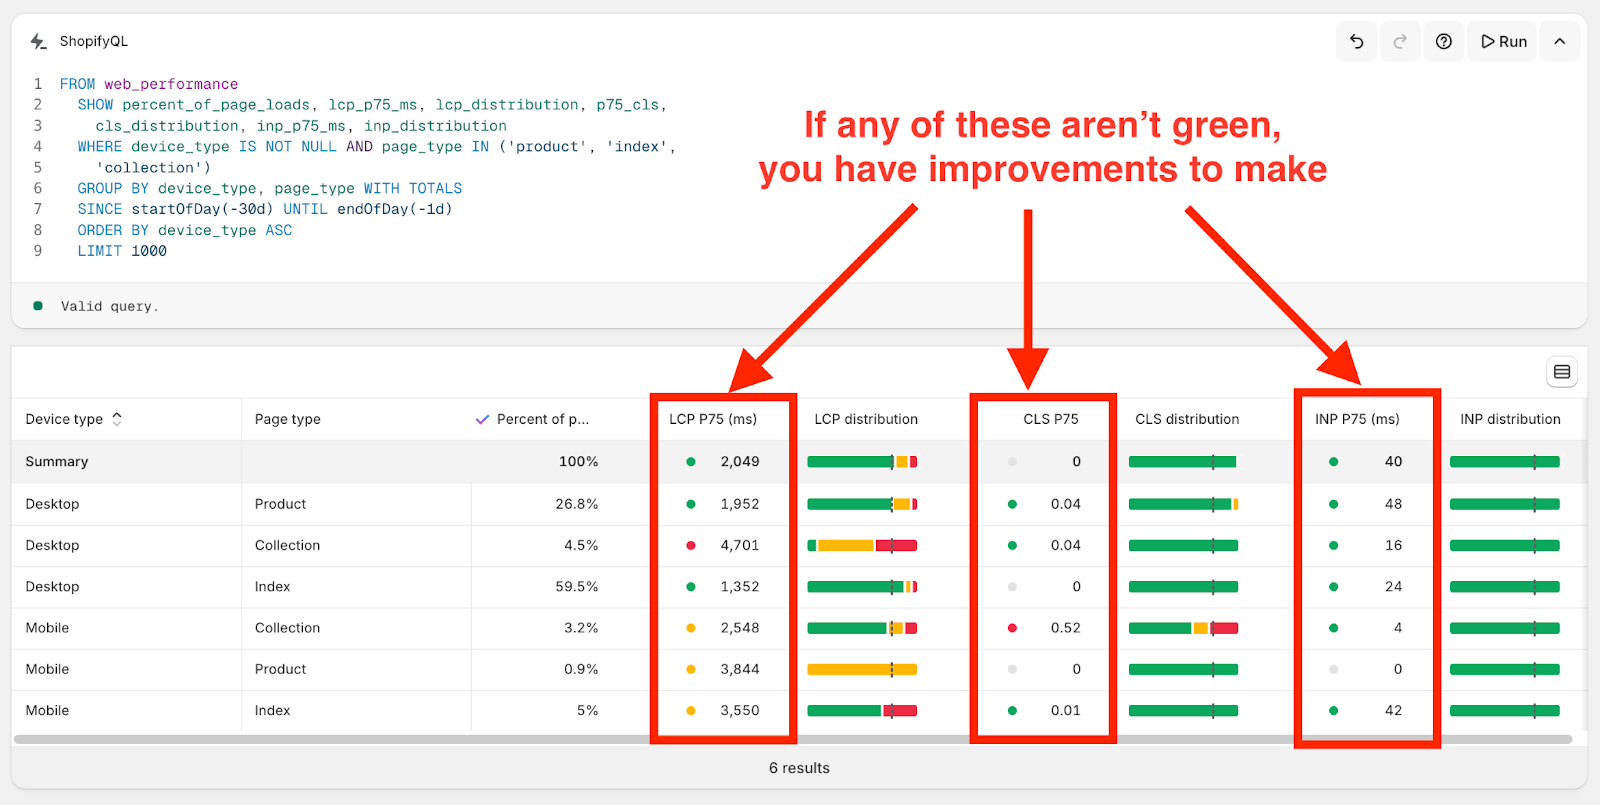
Dashboard 2: CWV over time, split by page and device type Jump to heading
Assuming you found an issue in the previous dashboard, it's time to dive deeper. We want to be able to track the CWV scores over time, to watch for changes that may be negatively affecting your performance.
FROM web_performance
  SHOW lcp_p75_ms, p75_cls, inp_p75_ms
  WHERE page_type IN ('product', 'index', 'collection') AND device_type IN (
    'Mobile', 'Desktop')
  GROUP BY page_type, device_type, day WITH TOTALS
  TIMESERIES day
  SINCE startOfDay(-30d) UNTIL endOfDay(-1d)
  ORDER BY day ASC
VISUALIZE lcp_p75_ms TYPE line LIMIT 6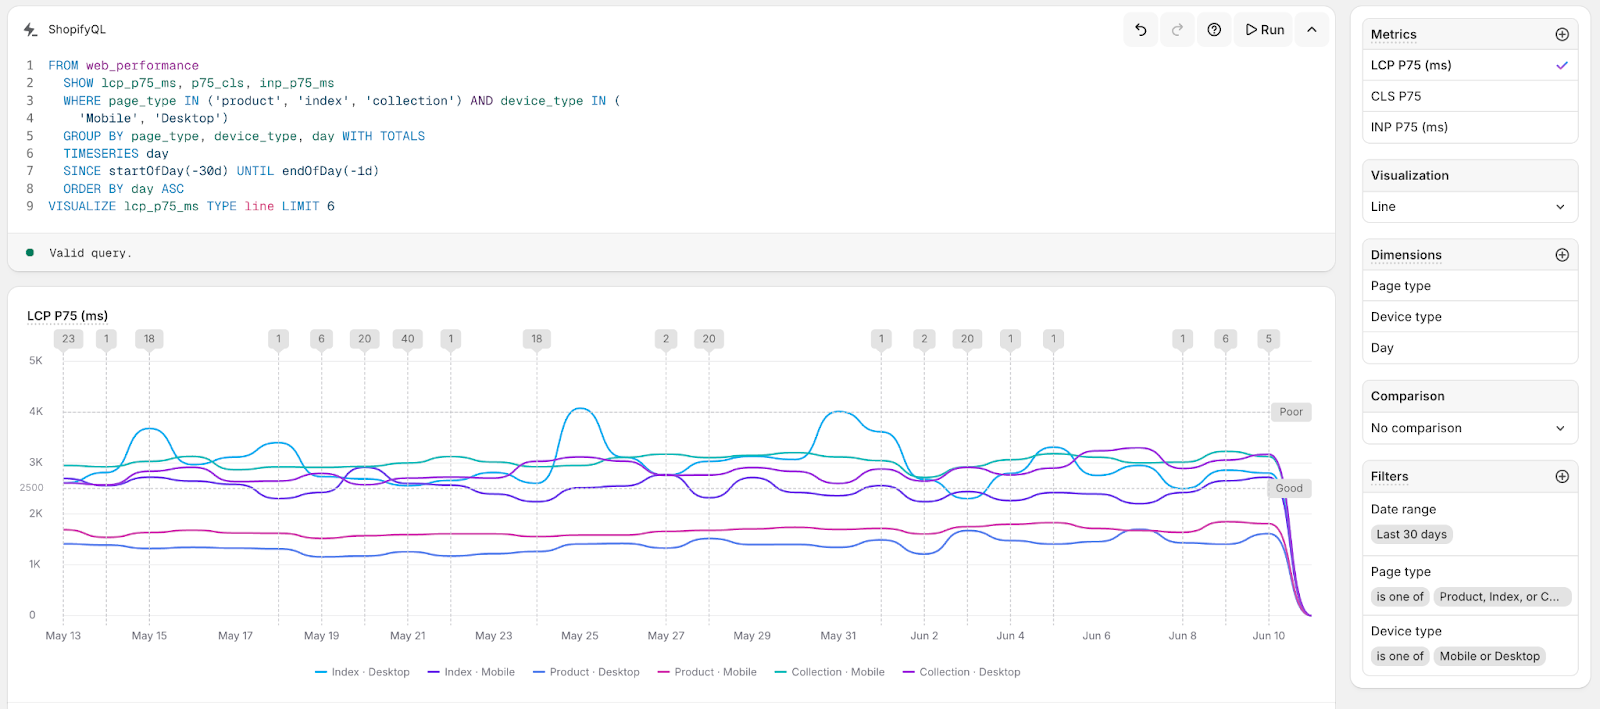
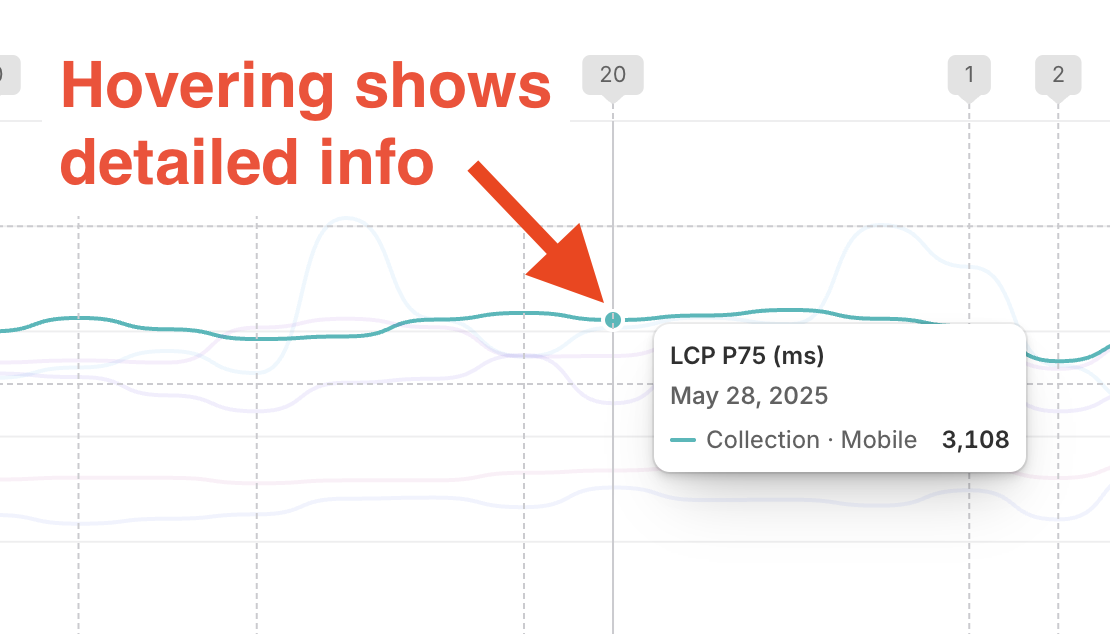
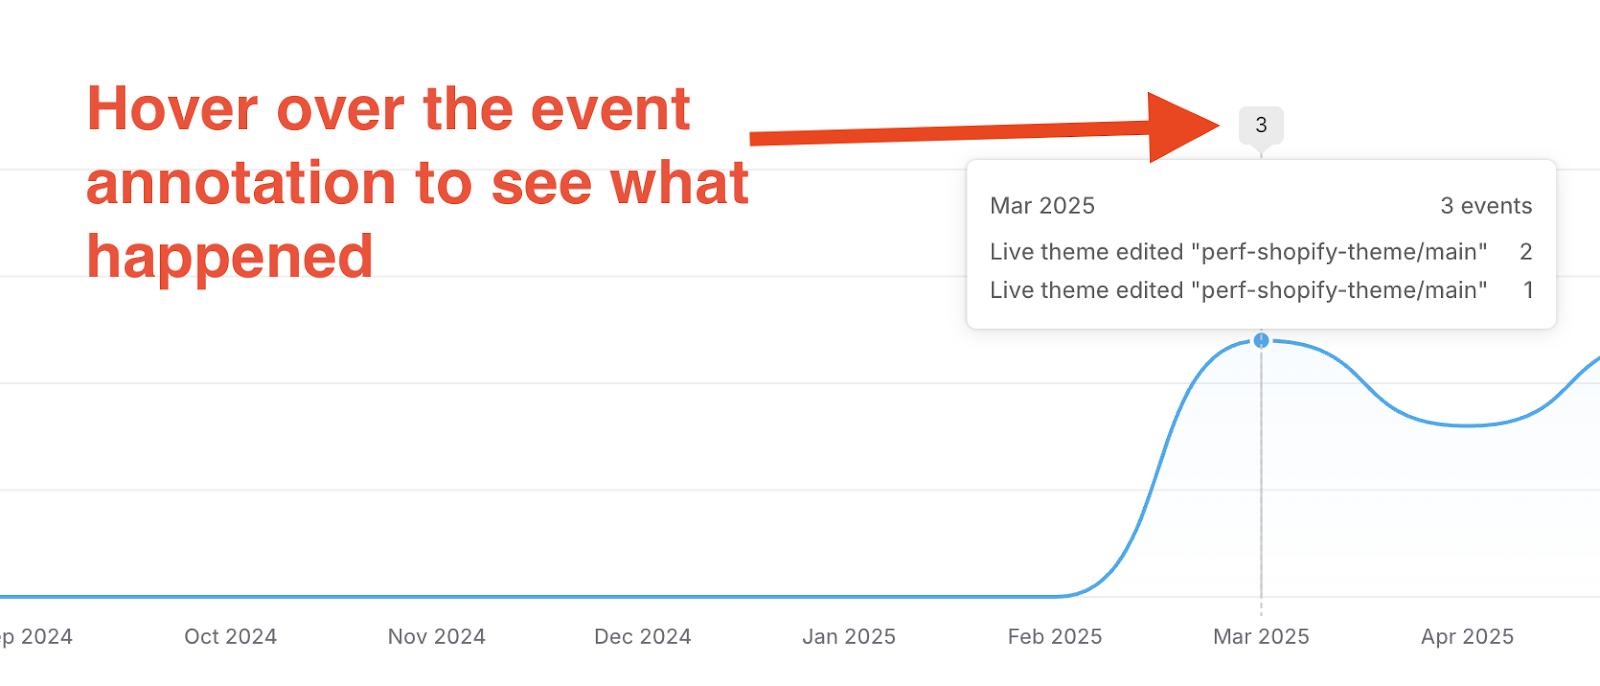
This report might be a little noisy, but if you hover over the graph, a little popup will show you more information about the point you're looking at.
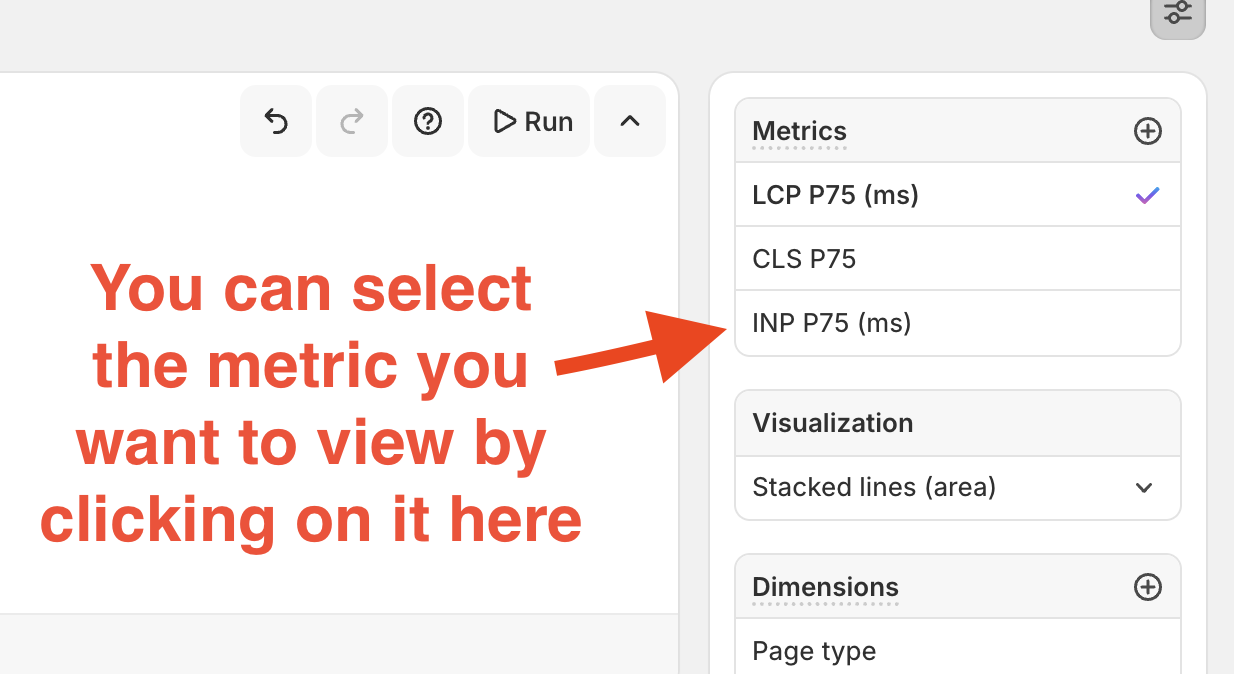
The graphs don't show all the metrics at once, but you can quickly toggle between them by selecting the metric you want to view in the top right corner.
The important thing to look for are the event annotations. Any time you add a new app or update the theme, an annotation is added to the graph. If the event corresponds to large changes in the graph, there's a good chance that something was introduced that is causing issues, as seen in the graph below.
Depending on the metric you're looking at, we can then dive deeper into one of the following dashboards to better identify the root cause.
Dashboard 3: LCP targets Jump to heading
The LCP metric is always related to an element on the page, known as the "target". This is typically the largest image in the page, such as the product image, but can also include large text areas and cookie consent popups. Our new web performance dashboards expose the target element for you, which is a new super power for identifying potential issues.
In this dashboard, we're building a table that lists the CSS selector for all of the LCP elements that need improvement (LCP > 2.5s), for your home page, product, and collection pages, sorted by the percent of pageviews.
FROM web_performance
  SHOW lcp_p75_ms, percent_of_page_loads
  WHERE page_type IN ('index', 'product', 'collection')
  GROUP BY largest_contentful_paint_target, page_type, device_type WITH TOTALS
  HAVING lcp_p75_ms > 2500
  SINCE startOfDay(-30d) UNTIL today
  ORDER BY percent_of_page_loads DESC
VISUALIZE lcp_p75_ms TYPE table
We sort by percent of pageviews because we want to focus on items that will have the largest impact on your actual traffic.
Once you have identified the element, you then need to work out how to load it faster. Sometimes it's something on the frontend (lazy loading your main image, client-side rendering, etc) and sometimes it's on the backend (slow server response time, aka TTFB). For that, you can use our LCP breakdown dashboard below.
Dashboard 4: LCP breakdown Jump to heading
Often, when trying to diagnose a slow LCP score, it's helpful to know if the problem is a slow server response (TTFB), a render-blocking resource (FCP), or if your LCP target is a late loading asset. We can create a dashboard that makes it easy to break this down to see where the issue is.
FROM web_performance
  SHOW ttfb_p75_ms, fcp_p75_ms, lcp_p75_ms
  WHERE page_type IN ('product', 'collection', 'index')
  GROUP BY day, page_type, device_type WITH TOTALS
  TIMESERIES day
  SINCE startOfDay(-30d) UNTIL today
  ORDER BY day ASC
VISUALIZE ttfb_p75_ms TYPE line LIMIT 6
For this one you'll need to toggle through the metrics on the top right corner to see how each one is performing.

In the examples below, you can see that TTFB is fairly flat, but when we switch to FCP, you see a huge plateau happening around June 2. You can also see from the annotation that there were 192 updates to the theme right before the spike. This means that someone must have introduced some render blocking script on the page when editing the theme, or something else that would prevent the screen from rendering.


Knowing where your LCP issues are at makes it easier to know where to start looking and where to focus your efforts. In the example above, yes, maybe TTFB is a bit high, but we know right away that the main culprit is on the frontend and that we should focus our attention there.
Read: Debugging common causes for slow loading in Shopify Liquid storefronts
Dashboard 5: CLS targets Jump to heading
CLS is a bit trickier to diagnose based on the information provided. CLS measures the amount of unintentional movement that happens on a page. It does this by measuring the distance an element was moved. The target selector only helps us identify the item moved, not the element causing the movement. Fortunately, once you know which item was moved, it's not too difficult to figure out which neighboring element is the problem (normally the one above it).
FROM web_performance
  SHOW percent_of_page_loads, p75_cls
  WHERE page_type IN ('index', 'product', 'collection')
  GROUP BY cumulative_layout_shift_target, page_type, device_type WITH TOTALS
  HAVING p75_cls > 0.1
  SINCE startOfDay(-30d) UNTIL today
  ORDER BY percent_of_page_loads DESC
VISUALIZE percent_of_page_loads TYPE table
Once you know what is shifting you need to jump to a browser to see what might be causing it. For example, throttling your connection speed in Chrome Dev tools can be an easy way to slow the page load down and make identifying the guilty section a lot easier.
Read: How to optimize cumulative layout shift on Shopify sites
Dashboard 6: INP targets Jump to heading
Let's make one more target table, this time for INP. INP measures how long it takes the browser to visually respond to a click, so our INP target is the CSS selector for the item that was clicked. Once you know that, it's a lot easier to identify the JavaScript code that causes the slow responses.
FROM web_performance
  SHOW percent_of_page_loads, inp_p75_ms
  WHERE page_type IN ('index', 'product', 'collection')
  GROUP BY interaction_to_next_paint_target, page_type, device_type WITH TOTALS
  HAVING inp_p75_ms > 200
  SINCE startOfDay(-30d) UNTIL today
  ORDER BY percent_of_page_loads DESC
VISUALIZE percent_of_page_loads TYPE table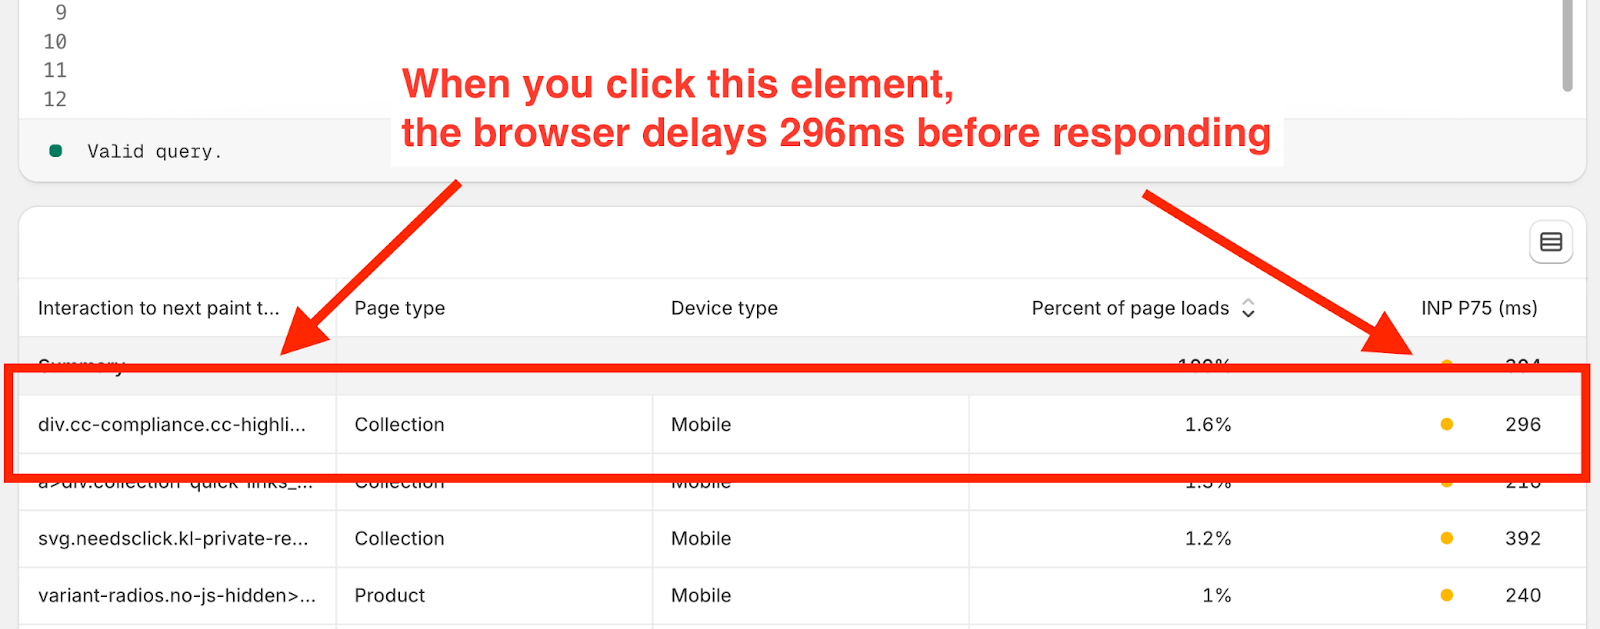
Admittedly, finding and fixing INP issues can be a challenging task, even when armed with the click target. We wrote about it when INP was first introduced, but it's probably time that we wrote our own guide to fixing INP issues on Shopify stores. In the meantime, Google's documentation on web.dev is super useful and is what our web performance team would reference ourselves.
Read: How to Optimize Interaction to Next Paint (INP)
Conclusion Jump to heading
Once you've identified the issues, it's time to roll up your sleeves and take action. You can DIY it by following the suggestions in our other blog posts, you can reach out to a partner or developer to help, or for the fastest turnaround time you can hire our web performance experts directly to fix things for you.
In a follow up post, we'll cover some common problem scenarios we can use these dashboards to help diagnose and solve.