

Updated: 14 Mar 2024
Web performance metrics can seem like an alphabet soup of acronyms. For someone new to the topic, it can be a real hurdle to understanding what's going on. In this post, I'll describe each metric in a beginner-friendly way. I'll also focus more on the concepts and impact of each rather than the technical definitions.
Jump to a metric:
- Time to first byte (TTFB)
- First contentful paint (FCP)
- Largest contentful paint (LCP)
- Total blocking time (TBT)
- Interaction to next paint (INP)
- Cumulative layout shift (CLS)
What are the Core Web Vitals? Jump to heading
The Core Web Vitals are a class of specific metrics created by the Chrome team. They are currently limited to 3 metrics which are focused on user experience (more on each later):
These three metrics together are meant to focus on how a user experiences loading, interactivity, and visual stability. We use several more metrics that help us debug performance issues, but these three are meant to summarize user experience. And guess what? User experience can impact SEO...
How do performance metrics impact my SEO? Jump to heading
Search engines try to offer the best content results for a user. Google considers how a user experiences a website to contribute to the quality of that content. We should already care about performance because it can lead to lower conversions and faster abandonment. Why would a search engine ignore those issues? Thus, the Core Web Vitals also feed into your search engine and ad rankings for Google.
How big is their impact? We don't know for sure, but content is still king. If your content quality is above competitor websites, you might be impacted less. However, for two sites with close to equivalent content quality, the faster one is more likely to be ranked higher. The lesson here is don't let web performance be the reason why you're losing your ranking.
What are the key performance metrics in 2024? Jump to heading
Now that we have a bit of context, let's cover each of the most popular ones in 2024. I've broken these up into three categories:
- Loading speed metrics: The Core Web Vitals focuses on largest contentful paint (LCP) for how a user perceives loading speed. It's one of the last steps for loading speed, so several things must happen before LCP. This is why time to first byte (TTFB) and first contentful paint (FCP) are useful metrics to track. They can break down that time to LCP in smaller chunks each with its own causes for slowness.
- Responsiveness metrics: Here, when I say "responsive", I'm talking about how the browser responds to user interaction. "Interactivity" is another way to think of it. Either way, JavaScript is usually what's to blame when a user attempts an action but the response is delayed. The Core Web Vitals metric is interaction to next paint (INP). Total blocking time (TBT) also helps us better understand the picture.
- Frustration metrics: Technically, all of these metrics lead to frustration. However, cumulative layout shift (CLS) is the only one that affects frustration but not speed.
Let's dive into each metric...
Loading speed: Time to first byte (TTFB) Jump to heading
Time to first byte, or TTFB, is the time from when a user first requests a page (clicks on a link or types in the URL) to when the first byte of data returns to the browser from the server.

A TTFB of less than 0.8s is considered good, and over 1.8s is poor.
Things that impact that TTFB are server response times (complex queries, high traffic) and distance to that server (no CDN).
If you're a Shopify merchant, most of this is out of your control except for the rendering of your website. Complex Liquid loops can make the server slower to respond. Check out How to Do an In-depth Liquid Render Analysis with Theme Inspector to learn more about how to measure your site and the common pitfalls.
Loading speed: First contentful paint (FCP) Jump to heading
First contentful paint, or FCP, is the time from when a user first requests a page (same as TTFB), until the first content (text, image, or non-white canvas or SVG) is rendered on the page. As you might have noticed, it also includes the TTFB. When we use FCP for performance debugging, we focus more on the time after TTFB.

An FCP of less than 1.8s is considered good, and over 3s is poor.
Things that can impact FCP outside of TTFB are render-blocking resources, connections to multiple domains (origins), and many more. Most problems are usually related to render-blocking resources. CSS is a render-blocking resource because we don't want to see the unstyled page before switching to a styled page. JavaScript can be render-blocking depending on how it is loaded and used. Learn more about how the browser renders a page and how to fix this issue in How to Eliminate Render-Blocking Resources: a Deep Dive.
Loading speed: Largest contentful paint (LCP) Jump to heading
Largest contentful paint, or LCP, is the time from when a user first requests a page (same as TTFB), until the last largest element on the visible screen (viewport). is rendered. It has the same starting point as TTFB and FCP. Similar to FCP, we focus more on the time after these other metrics when debugging LCP.

An LCP of less than 2.5s is considered good, and over 4s is poor.
Most LCP elements are images. Often, the LCP element will change based on screen size since we build websites to be responsive and mobile-friendly. Thus, common things that can impact LCP are related to loading of the image or font used for the LCP element. For example, if you use a front-end framework like Vue or React, the browser might not know that it needs an image until after it has downloaded multiple files and parsed (read) them. Another example is poor prioritization leading to less critical assets being loaded before the ones needed for the LCP element.
Learning how to use a tool like WebPageTest is key for finding and fixing problems related to both FCP and LCP. Check out our post How to benchmark and compare tests using WebPageTest if you want to get started.
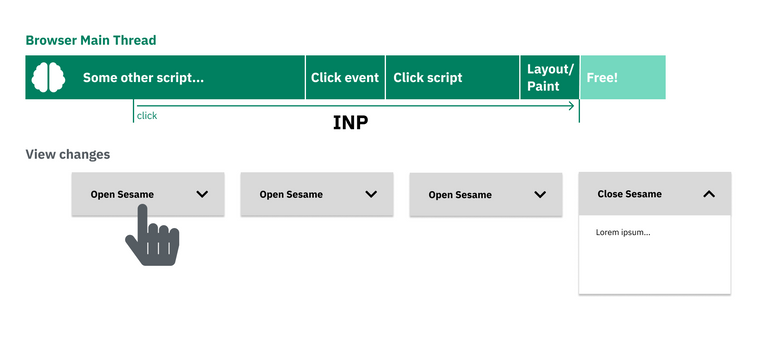
Responsiveness: Interaction to next paint (INP) Jump to heading
Interaction to next paint, or INP, measures the amount of time it takes for the browser to paint the next frame (show a change on screen) after a user interaction. Think of when you click on a button on a website but don't get any visual feedback that you performed an action until after some delay. INP can only be measured with real users. It is measured for the duration of a session, not just for the first interaction, and reports the worst or nearly worst time.
An INP of less than 200ms is considered good, and over 500ms is poor.
Too much JavaScript running on the main thread is the primary culprit for INP problems. The main thread cannot run scripts and respond to user inputs at the same time, so long scripting time trips up responsiveness. This could be due to long tasks, too many dependencies, too many third party scripts, and more.
On merchant sites, we see a lot of app and third party and tag manager bloat. Remove ones that are no longer used, and evaluate the rest in terms of the trade-offs between performance and feature benefits.
For slow INP later in the page lifecycle, evaluate specific interactions using a performance profiler to look for opportunities to reduce or prioritize work on the main thread.
Responsiveness: Total blocking time (TBT) Jump to heading
Total blocking time, or TBT, measures the amount of time the main thread was blocked from FCP until time to interactive (TTI). TTI is when the main resouces have finished loading and the main thread can reliably respond to user input. Remember how INP can only measure real user interactions? TBT is a "lab" metric that we can measure anytime we run a test. It helps us better predict when we may have a problem with responsiveness that would show up in INP.
A TBT of less than 200ms is considered good, when tested on average mobile devices. The same causes for poor INP lead to poor TBT.
Frustration: Cumulative layout shift (CLS) Jump to heading
Cumulative layout shift, or CLS, measures the largest "burst" of unexpected layout shifts during a page session. The technical definition can be complex, but generally we don't want the elements on a webpage to move around unless the user would expect it from an interaction. Layout shifts can be very annoying. Think of how many times you clicked the wrong button because it shifted down right before you clicked. Or when you lose your place while reading an article because an ad finally finished loading.

A CLS of less than 0.1 is considered good, and over 0.25 is poor. It lacks metrics because the score is the product of the impact fraction and distance fraction. To understand the calculation in more detail, check out the Layout shift score.
Common culprits for unexpected layout shifts include:
- An advertisement or image loads (without space reserved for it)
- An announcement or cookie banner injected at the top of the screen
- A shift from a fallback font to a webfont
- An animation
Make sure you reserve space for images and try to provide better fallbacks for webfonts.
Resources Jump to heading
Check Using the Chrome UX Report on PageSpeed Insights for the latest metric thresholds.
Cover photo by Mitchel Boot on Unsplash