

WebPageTest is one of the richest tools in the web performance toolbox. It allows you to instantly test your site’s speed, usability and resilience in real browsers, devices and locations around the world.
In this post we will show you how to benchmark the speed of your online store and compare results after changes have been made using WebPageTest.
Whether you are technical or not, by the end of this post you will be able to carry out one of the most important tasks in performance engineering.
How does it work?
WebPageTest is a synthetic testing tool, meaning the results are not based on real user experiences. Instead, they are carried out in a controlled environment where you can keep the device, browser, location and connection speed consistent. This can help you focus on the details and impact of any changes you have made.
Running a test
Step 1 - Navigate to http://webpagetest.org

Step 2 - Click to open the Advanced options
Don’t worry about the word “advanced” in the heading. Using most of the default settings will still apply. The main reason for using this option is to access all the testing locations which is important if your users are not based in the U.S.

Step 3 - Select your options
The best thing to do when running a test is try and mimic your largest user group location, device and browser. It is likely you have more mobile users on your store and possibly more iOS users. While you can test on Safari and real iOS devices they are limited to the U.S. If the majority of users are not based in the U.S. we recommend using an emulated device in Chrome. This is the example we have stepped through below.
Website URL - Add the URL of your store (recommend starting with your home page)
Test location - Select a location nearest to where your end users are based.
(Tip: If the node is busy there will be a warning by the browser dropdown. If you don't mind another location, change your selection, if not then it’s time to make a coffee when the test is running)
Browser - Select the browser that best represents your users.

Desktop browser dimensions - leave this as the default
Number of tests - recommend 3 as the tool allows you to select the median result which can help remove any strange one-off behaviour. If you want more accuracy, you can increase the runs up to a maximum of 9.
Repeat view - If you want to test how the website performs on repeat views, test both first and repeat views. Repeat views help us see whether our website cached assets well or not. For the purpose of this post and the simple test leave this option on “First view only”.
Capture video - ALWAYS SELECT THIS! This will show you frame by frame how the page loads
Label - This field is optional but if you want to look back at your results and be reminded what it was then add a label here e.g. “Home Page Benchmark”.

Step 4 - Click start test

This will open a new screen to inform you where in the queue the test is.

Once the testing finishes, the page will automatically update with the results. You can also save and come back to this URL later to see the results.
Analyze results
WebPageTest provides a wealth of valuable information. This is great, but it can also feel overwhelming when you're new to the tool. In this section is an outline of the most useful parts to focus on for beginners. The main navigation is handled using the “View” dropdown shown below.

Performance summary
This view shows the high level information on the test that you ran. The tool will suggest how well you did against its own benchmarks that measure Speed, Usability and Resilience. This can be a good indicator to where you should start any improvement efforts.
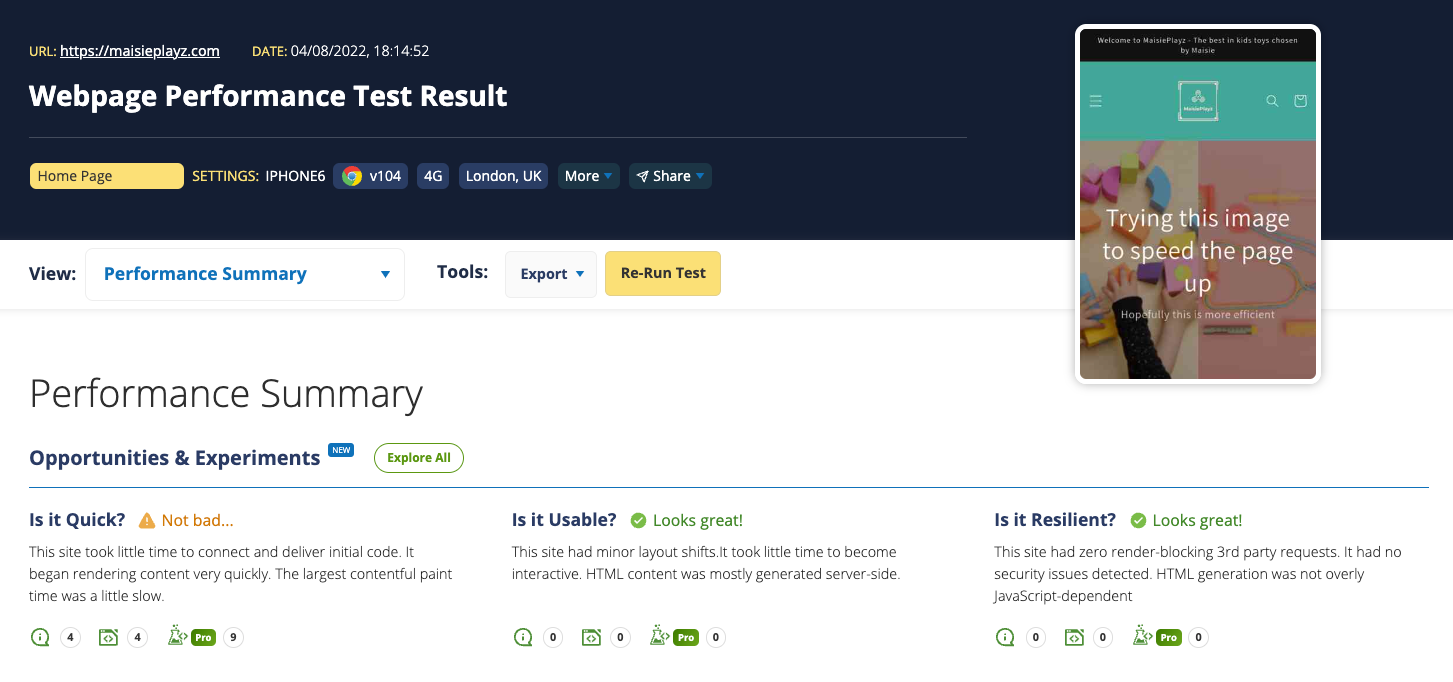
In the Observed Metrics section there are some key numbers about the page load. The world of metrics is complex, and it’s worth reading more to understand what they mean, how they are measured, and what you can do to improve them.
LCP, CLS, and TBT, the Core Web Vitals, are color coded. Green represents a good user experience, and yellow and red represent needs improvement and poor, respectively. If any are red or yellow, then instantly you have an area to focus on.
In the example below the CLS is yellow and this should be investigated.

First Byte (TTFB) - TTFB, or time to first byte, is the time it takes the server to respond to the request for the page. A good target is under 1 second. Shopify merchants can impact this number with custom liquid code and overly long pages. Avoid nesting loops in liquid, and keep the length of pages reasonable.
First Contentful Paint (FCP) - FCP is the time it takes to paint the first page content such as text or images. A good target is under 1.5s. To speed this up, only load content up the top of the page you need for rendering, anything else can be loaded later.
Largest Contentful Paint (LCP) - One of Google’s Core web vitals, LCP is the time it takes to display the largest element visible on the screen. This is usually an image but can also be a block of text. A good target here is less than 2.5s.
Cumulative Layout Shift (CLS) - Another one of Google’s Core web vitals, CLS is a measure of how much unexpected movement there is in your page as it loads. Unexpected movement can be really annoying, especially as pages move around when you try to interact with them. An example of a layout shift is when an image finally loads, shifting content down. A good target here is less than 0.1 and you can improve this metric by specifying height or aspect ratio in images and other blocks of your page.
Total blocking time (TBT) - Since a WebPageTest result is not real user loading the page and interacting with it, this measure is designed to give an approximation of Google’s core web vital First Input Delay (FID). It totals up all the JavaScript tasks taking longer than 50ms to run. A high score here will mean there is more chance a real user interacting with your page will experience the behavior of clicking a link and nothing happening for an unsatisfactory period of time, or for the page not to scroll smoothly. A good target for TBT is less than 200ms. You can improve this metric by reducing the JavaScript on a page or reducing the complexity of the JavaScript you run.
Filmstrip view
The filmstrip view shows a visual representation of your page load. It also shows a more complex waterfall chart.
Below are some simple steps to use this page.
The film strip is a single image of the page loading at various points in time. Move the image left and right and line it up with points of interest.
In the example below we have lined the film strip up with the point at which the page starts to render.

Underneath the film strip is a table of all the objects that make up the page called a Waterfall chart. The information displayed can be very daunting at first glance.
Each row represents an object on the page, listed by the URL. For each object there is the timing information for:
- When the browser started the request
- How long it took to connect to wherever that object came from
- The time it took for the object to download
All timing bars are color-coded, and the legend explains what those colors mean.
In an ideal world, everything would load in a straight line and the page would load in under a second. This is not how things work in the real world. A browser spends time on lots of different tasks, including;
- Understanding the CSS you provide for layout and style.
- Building functionality in JavaScript.
- Loading and converting images to something we understand.
Some of these tasks are dependent on each other. Others block all other tasks from happening at all. The bigger and more complex the page, the longer these tasks will take to complete.
WebPageTest is useful to highlight inefficiencies. But, optimizing a page can be super complex.
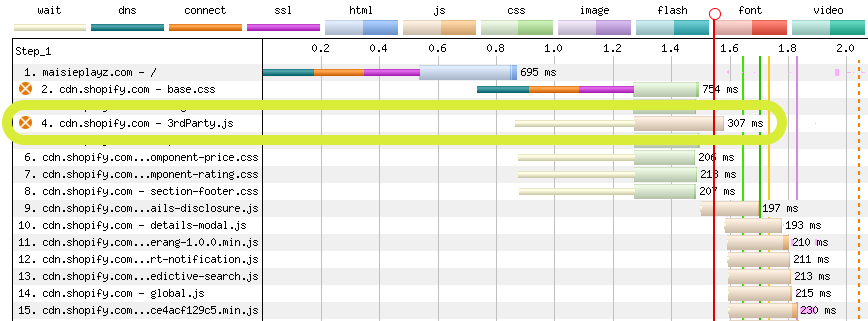
The image below focuses only on the objects loaded before the page starts to render. There are 2 resources highlighted with an orange circle with a cross. This highlights resources that block the browser from rendering content.

The 4th object is a self hosted JavaScript object from a 3rd party. Often these do not need to be loaded so early in the page and can take advantage of being deferred.
The aim of this post is not to provide a complete list of how to optimize a page but some common tips to improve slow rendering include:
- Reduce render-blocking resources
- Move fonts to the Shopify domain
- Load JS that is not important using defer (or async), or just lower in the page
- Experiment with preloading key resources but don’t try and preload everything (3-7 small files is usually best)
- Use liquid filters to preload content in favor of just adding the HTML
For the purpose of this post the script was deferred and was moved nearer the bottom of the page.
Run a Comparison
After making a change to your store, repeat the “Running a test” steps above. Be sure to select the same options from the first test but give the new test a new label that will help you remember what you changed.

Start the test as before.
To compare how the two tests performed select the Test History menu option at the top of the page.

This will present you with a screen of all your recent tests.

Select the tests you want to compare, and click the “Compare Selected Tests” button.
This will take you through to a screen similar to the filmstrip view discussed above, but in this view the two results will be side by side.
Instantly you can see our change has had a positive impact.

The waterfall charts are also comparable in this view.

Clicking on the heading above will reveal a slider where you can slide the transparency to compare the 2 tests over the top of each other.


While the above view can be confusing when the views are mixed, sliding the bar from one side to the other can help highlight where things got better or worse between tests.
Below is the waterfall after the script was deferred. It is now loaded at object 14, after the page has started rendering.

As a reminder the image below shows the first test when the JavaScript was loaded and executed before the rendering.
Summary
In this post we showed you how to test your store using WebPageTest.
WebPageTest is a free synthetic testing tool great for baselining performance and measuring small changes.
We encourage you to follow similar steps on your store on a regular basis. Especially before and after any changes you make. In summary,
- Run a test to take a benchmark
- Review the Performance summary and look at the high level metrics
- Look at the visuals of the page loading in the filmstrip view to see what a user saw
- Use the waterfall to see what is happening under the hood of the browser
- See if anything obviously caused delays
- Make changes to your code
- Test again and compare
WebPageTest is a great tool for measuring performance, and it can take some time to understand all the features and what to look out for. To improve your skills at using it and identifying performance issues, we highly recommend attending the WebPageTest livestreams on Twitch. Recordings are also available to watch past livestreams.
Our Professional Services team is also available to provide web performance services as well as many experts in the Shopify Expert Eco-system.