

Updated: 14 Mar 2024
As Addy Osmani likes to say, JavaScript is your most expensive asset. Compared to an image or stylesheet, for example, a JavaScript file of the same size will take the same amount of time to download. The problem comes in the amount of processing after download that needs to occur before the JavaScript is fully executed.
When we’re building websites, we can start accumulating excessive amounts of JavaScript in two primary ways:
- Building a website using a JavaScript front-end framework like Vue, React, and Angular plus all the dependencies involved in that type of architecture
- Adding a lot of third-party scripts and applications (or Shopify apps)
When I work on optimizing a website, one of the first steps I do is evaluating all of the JavaScript needed for page load. While Interaction to Next Paint is the user-experience metrics most dependent on JavaScript, I don’t necessarily start debugging INP right away. First, I like to look for low-hanging fruit to trim out before tackling the more complex task of debugging those metrics.
So how would we tackle any possible low-hanging fruit?
The Pareto principle states that for many outcomes, roughly 80% of consequences come from 20% of causes.
-Pareto principle, Wikipedia
The 80/20 rule works well here. Roughly 80% of web performance problems come from only 20% of the possible causes. In this article, I’ll show you 3 ways to find and rank your JavaScript for page load so that you can more quickly identify your worst offenders.
Rank by bytes: Lighthouse Treemap Jump to heading
Treemaps are a way of visualizing data both by category and by size. In this example Lighthouse treemap, each box represents a JavaScript file or module. The box is sized relative to the total bytes for that file or module so that you can quickly see which files or modules are the largest.

Additionally, we can see some boxes which have additional boxes inside of them. These sub-boxes represent JavaScript modules and are shown if sourcemaps are included. We can quickly see from these that various components, Google Tag Manager, React are the largest dependencies for Starbucks’ codebase.
Now that we have this information, how might we use it?
- First, I’d go through the list and make sure you’re still using all the third party code. Once I helped a merchant find a 2MB third party script that they thought they had uninstalled from their storefront.
- Second, I’d make sure I still needed all the third parties shown. Over time, these third party scripts and apps can balloon because we forget to go back and remove the ones we no longer need.
- Third, I’d take this list back to marketing and the business leaders to see if there is an opportunity to remove some of the ones that are low-value or duplicate the features of others.
- Finally, for first-party code, I’d look for the largest dependencies to see if there are options to remove or replace them with smaller options.
Here’s a quick video showing you how to access and use Lighthouse Treemap:
Lighthouse Treemap has some additional features which you should check out. Read Explore JavaScript Dependencies With Lighthouse Treemap to learn more.
Rank by scripting time: Dev Tools Performance tab Jump to heading
For our next tool, we’re going to rank all the scripts from a single domain by their total scripting time. Scripting time is the amount of time the script was running during the measured time period. For this case, we’re measuring the scripting time during load.
In this short video, I show you how to access and use this tool:
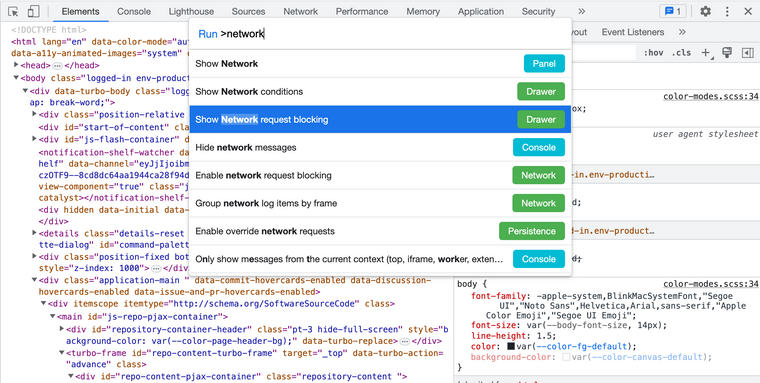
You can go one step further by blocking third party domains individually and rerunning the performance profile on load then compare the before and after. The easiest way to find Network Request Blocking is to open up Dev Tools and use Cmd+Shift+P to open up the shortcut finder. Start typing “network”, and you’ll see “Show Network request blocking” in the list:
The network request blocking tab will show up below the scripting summary area. Here you can click the + button to add a URL or entire domain to block for the next load. Don’t forget to uncheck “Enable network request blocking” when finished.
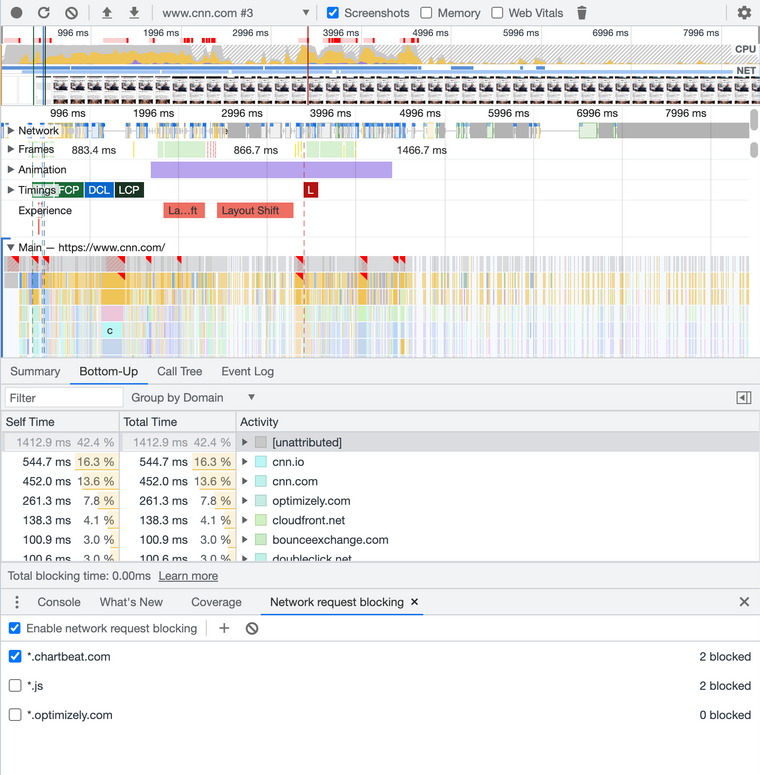
Now you can re-run the performance profile on load and compare the results between tests. The dropdown showing the URL tested shows you the test history so that you can switch back and forth and compare the results. Blocking all requests from chartbeat (runs 2 and 3) resulted in a 0.5-1s improvement in total scripting time in this example. If I wanted to improve this analysis, I’d run the profiles several times and choose the medians for both before and after to compare.

Rank by blocking time: WebPageTest Jump to heading
Blocking time is arguably the metric we should prioritize the most because it impacts user experience. Blocking time is the amount of time that the main thread was blocked which prevents the browser from reacting to user input.
In this short video, I show you how to use WebPageTest to see a ranked list of script origins by their total blocking time:
Similar to scripting time, we can selectively block scripts in WebPageTest and compare before and after. Read Using WebPageTest to measure third party apps to learn how.
Conclusion Jump to heading
In this article, I showed you three ways to rank your JavaScript from worst to… least bad. We looked at ranking by:
- Total bytes using Lighthouse Treemap
- Total scripting time using the Chrome Dev Tools performance tab
- Total blocking time using WebPageTest
I use all of these methods to try to find some quick wins to strip out of my code before tackling the more difficult task of optimizing for Interaction to Next Paint. We’ll cover a deep dive into those in a future article.
Cover photo by Greg Rakozy on Unsplash