
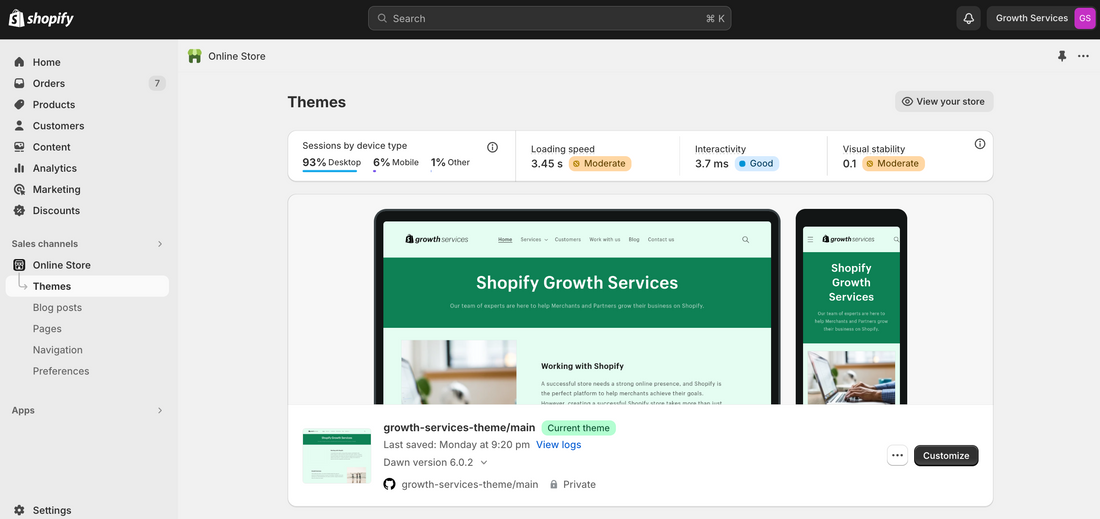
As of today, January 31, 2024, Shopify will begin rolling out a new web performance dashboard for Liquid storefronts over the next few weeks. The dashboard provides the ability to review and optimize real user experience. This new tool (accessible on your Online Store -> Themes page) lets you dive into your store's speed, stability, and interactivity. These are Google’s widely adopted Core Web Vitals and replace the old Speed Score.
Shopify is committed to making our platform lightning fast for our Merchants. In the past year we have expanded our infrastructure, resulting in 35% faster performance.
Yet, improving frontend performance is a joint venture between us and our merchants. With the new dashboard we provide you the insights and opportunities to improve your performance, which can improve conversion and reduce bounce rates.
Understanding the importance of Core Web Vitals Jump to heading
Good user experience is key to turning traffic into sales. Customers expect websites to load quickly, intuitively and be responsive. Google introduced Core Web Vitals to help measure and improve user experience. These metrics provide a standard way to measure and optimize user experience. Using real user data, they are more representative of actual performance. Scoring well in web vitals feeds into better SEO results as well as higher conversion rates.
Goodbye speed scores; Hello real users Jump to heading
The previous Speed Score used a single Lighthouse score to assess site performance. But, Lighthouse’s scoring criteria have their limitations. They fail to represent real-world user experiences, leading to confusion and frustration. We recognized this problem and created a solution that overcomes these limitations.
The new web performance dashboard captures actual interactions and experiences from real users. This provides a fuller understanding of how your website performs in the real world. This includes all the variations of connection types, device types, locations and browsers.
How to use the real user performance dashboard Jump to heading
For full details on how to use the dashboard head to the help docs. Below are some of our top tips to get started.
1. Low data or no data
If you're getting started with your Shopify Store, or have limited data, don't worry. The web performance dashboard provides valuable insights even with low or no data. With low traffic, performance can appear to jump around from day to day. If this is the case, try grouping data by week or month.
2. How to read the dashboard
With the web performance dashboard, pinpointing performance issues becomes easier. Rather than a single score we now provide data and ratings for 3 areas that impact user experience.

- Loading Speed represents how fast the page loads for the user
- Interactivity represents how responsive the site is when a user interacts with it
- Visual Stability represents how smooth the page loads, avoiding sections jumping around
Any rating that is not marked as good represents an opportunity for improvement. The data point provided for each measure is the reading from the 75th percentile. This means that 3 out of 4 users would have experienced a better experience than the rating. The 4th would have experienced something worse.
You can explore the data further by clicking on the metric titles.
This opens a more detailed view of each metric. You’ll see the percentage of users falling into each bucket of good, moderate and poor. Using this data you can quickly identify areas that need improvement.

Clicking the metric title or the icon in the top right corner of each card (and metric) will take you through to the time series breakdown.
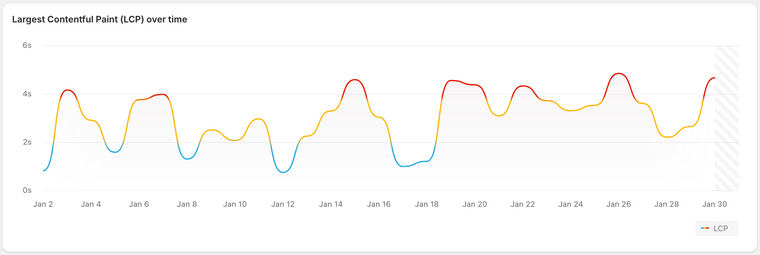
The time series chart shows how the score changes over time. If the score got worse on a specific day it may show an app install, theme update, or new code has slowed things down.
Recommendation: For low traffic (<20 views per day), use filters to group data into weekly or monthly buckets.
Below the time series chart you will find the number of visits for each day. Visits are color-coded by the rating (good, moderate, poor).

Note: The graphs for different metrics can show a different number of visits. This is normal as some browsers do not record all metrics. Also, if a user does not interact with a page there will be no FID recorded.
3. What to do
Any project to optimize performance needs to be a good investment of time. To help answer that question you can use the dashboard in 2 ways.
-
Do you have enough traffic for the project to be valuable?
While everyone wants a lightning fast store, you still need traffic and users in order to sell anything. If the number of users per day is less than 100 we would recommend running a project to increase traffic first. -
Is performance stopping people from buying?
Any metric that is not ‘Good’ is an area where you can improve user experience. Whether it's optimizing code, prioritizing image loading, or fine-tuning layouts. The web performance dashboard empowers you to make data-driven improvements.
You can discover strategies on how to solve common web performance problems using the resources below the dashboard. These should be applied to the most visited pages on your store. These are typically product, collection and home pages.

4. Use the public API to access the raw data
The API is released under the public unstable GraphQL version, currently gated by our RUM beta flag.
You can use the API to create your own charts or export into 3rd party tools. The public API powers the charts in the admin giving you access to all the data. As well as the performance data you can also access the performance events. These will help diagnose changes in performance.
The GQL schema links for each endpoint are below:
Note: The user or app needs access to “reports” and “themes” to access this data via GraphQL.
5. What's next
We're planning exciting dashboard enhancements. Stay tuned for updates that will further empower you to boost performance and user experiences.
Summary Jump to heading
With the new dashboard, use real user data and Google’s Core Web Vitals to transform your website's performance. Say goodbye to ambiguous metrics and welcome insights that enhance your buyers’ experience. Start using the web performance dashboard today and unlock your online store's potential.
Access the report via:
- The admin menu for Analytics -> Reports -> Online Store Speed
- The admin menu for Online Store -> Themes -> Click-through the banner at the top of the page
You can read the full developer documentation here.