

We worked with Carpe to improve their key performance metrics resulting in a 52% faster Largest Contentful Paint and a 41% improvement in Cumulative Layout Shift. These upgrades lifted Carpe’s online store conversion rate by 5% and increased traffic by 10%, leading to a total 15% increase in revenue.
Carpe aims to tackle one of the most common and annoying conditions people have. Their mission is to help those suffering with embarrassing, uncomfortable sweat through a set of dermatologically and clinically tested products.
After noticing a decline in online store speed over several months, the company decided it was time to do something about it. Performance can be a complex topic, so we were thrilled to support their talented development team. That way, both sides could use their expertise and domain knowledge to provide the most impactful, time-efficient results.
Discovering performance opportunities and setting goals Jump to heading
If you read our previous case study, you may already know that the first step of every performance engagement is to set a baseline. As before, we start by analyzing WebPageTest synthetic tests and the real user data.

The investigation quickly surfaced the following issues:
- All pages were suffering from slow rendering times. All the milestone metrics for page speed: TTFB, FCP, and LCP were high.
- Cumulative Layout Shift was dangerously close to not fulfilling the good user experience threshold of 0.1 at 75th percentile.
We decided that a good initial goal would be to make sure that the website fulfills all of the Core Web Vitals requirements. This would ensure that at least 75% of its visitors get a fast experience and allow it to rank a bit higher in Google’s search results.
Addressing common issues Jump to heading
When it comes to rendering, our experience tells us that there are two common issues across Shopify ecosystem: external render-blocking resources and incorrect lazy-loading of images.

By analyzing the WebPageTest waterfall, we were able to quickly rule out the first issue. The browser needs to wait for only one external resource before painting, which is a personalization script that has to stay anyway. The same waterfall shows that the hero image is requested quite late. Being the 19th resource on the list suggests it’s initially hidden from the browser, resulting in high Largest Contentful Paint.
After a deeper analysis of the HTML, we confirmed that the page suffers from incorrect lazy loading and a generous usage of non-decorative background images. Both of those things should not be used for important, above-the-fold graphics as they hide them from the browser's preload scanner. Through a detailed report, we made sure that all of the best practices outlined in our articles around images’ performance were applied to address the slow LCP.
When it comes to Cumulative Layout Shift, we made sure that the images had their dimensions specified in the HTML. We also did some fixes around the space reservation for the top part of the product page. This was more than enough to stabilize the layout and improve the combined CLS score for the entire origin.
Liquid overflow Jump to heading
We all knew, since the very beginning of the engagement, that simply addressing common frontend problems would not be enough. Looking at the metrics, we saw it was virtually impossible for render times to fit inside the “good” threshold without addressing the server response time. While we never recommend this as a first step, Time To First Byte values over 1 second suggest there may be some issues worth looking into.
As a Shopify merchant, your safest bet when it comes to slow server responses is to analyze the theme's Liquid logic. By following a guide on how to use Shopify Theme Inspector we were able to spot some issues.

Carpe has an extensive frontend logic around bundles, discounts, deals, and cross-sell suggestions – all of which require product information. Liquid loops were used to serialize all products and their variants in JSON, that was then parsed by JavaScript on the client. This quick and simple solution may have been fine initially, but with a growing number of products, rules, and metafields, it started to slow down over time.
Our initial idea was to move all non-critical product data fetching to use the Storefront API instead. Unfortunately, we quickly discovered two roadblocks:
- The information was used in many places across the code and the majority of logic assumed it can be accessed synchronously.
- All of the rules and relationships were based on the product SKU, meaning it wouldn’t be optimal to fetch them via an ID-based API anyway.
With the above in mind, we decided to opt for some quick wins instead. We switched from serializing the whole product to extracting only a few fields that were required. We also made sure that only the necessary parts of logic stay on a certain type of pages. This reduced the rendering time significantly, giving the team time to work on bigger refactoring without pressure because of poor performance.
Results Jump to heading
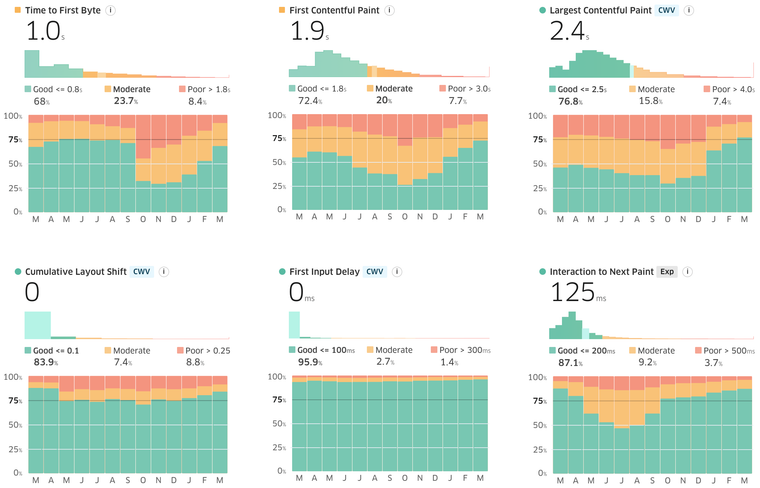
As of March’s Chrome User Experience Report (CrUX) update, Carpe’s online store achieved good scores across all their Core Web Vitals.
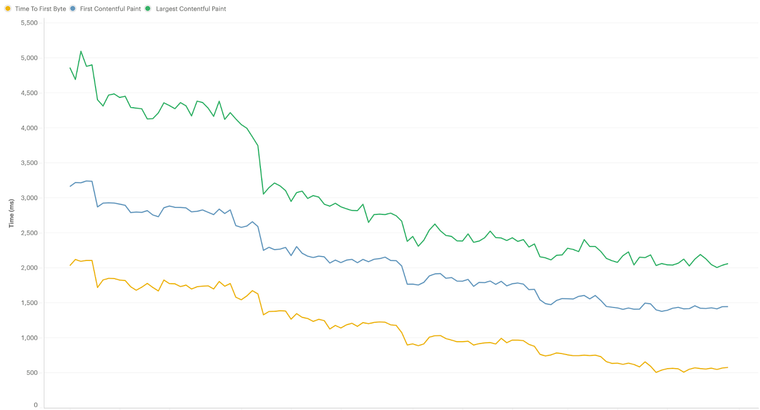
Our internal analytics show a 52% improvement in Largest Contentful Paint and 41% in Cumulative Layout Shift at the 75th percentile.
Working with the Shopify performance team allowed us to take the Carpe website to the next level of user experience. As a result, we were able to drive more traffic to the website and increase revenue by 15%.
Director of eCommerce, Carpe
About us Jump to heading
We are the Professional Services Web Performance Team. Our goal is to help merchants get their online stores as fast as possible through direct paid engagements, platform work and education. Learn more about our services, or check out our blog and getting started page to begin your own performance journey.