

Largest Contentful Paint (LCP) is a performance metric that measures the time it takes for the largest visible content element on a webpage to load and become visible to users. This element could be an image, video, or block-level text element, and it's a key indicator of a page's perceived load speed.
Many Real User Monitoring (RUM) tools provide details about the CSS selectors of LCP elements and their reported LCP scores. However, debugging the potential issues causing slow LCP values can be challenging. This article will walk you through the debugging process. If you missed the first chapter where we explain what a CSS selector is, you can read it here.
Setting Up for Debugging Jump to heading
To begin debugging, reproduce the page load conditions by recreating the exact (or a very similar) scenario where users experienced slow LCP. You can start by determining whether the issues occurred on desktop or mobile devices, and identify the common connection type (such as 3G or Slow 4G) when LCP issues were reported.
Then, use Chrome DevTools' Performance panel to emulate these conditions by setting specific device dimensions, adjusting network conditions, and if necessary, throttling the CPU to simulate slower devices. This setup ensures you're testing under conditions that match real user experiences.
To open the Chrome DevTools on Windows or Linux, press F12 (or Ctrl + Shift + I). On Mac, press Fn + F12 (or Cmd + Option + I).

Next, locate the CSS selector by navigating to the Elements panel. Use the search function (Ctrl + F on Windows/Linux or Cmd + F on MacOS) to find your specific selector. If you can't immediately spot the selector, don't worry – check a few common scenarios first: verify the cookie notice status (whether it's accepted or rejected), consider any pop-up conditions such as newsletter prompts, and examine other page load conditions that might trigger the element to appear.

Identifying the LCP Element Jump to heading
To locate the LCP element, open the Performance panel in DevTools and hit Record and reload to capture the page load under your defined conditions. Once the data is collected, head to the Insights tab where you'll find the LCP score that has just been captured – click on it to dive deeper. This will reveal the LCP summary, which contains the related node information that helps identify exactly which element is triggering your LCP score.

After locating the LCP element, verify it by clicking the related node, which will highlight the element in the Elements panel. Double-check that this highlighted element matches your target element. If you notice any discrepancies, first verify that your device screen sizes and webpage status align with the reported user conditions.

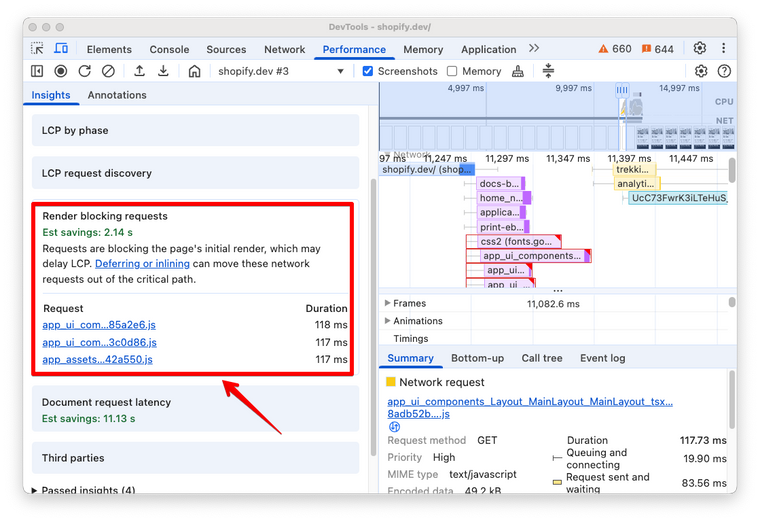
Addressing Common LCP Issues Jump to heading
To begin debugging LCP issues, navigate to DevTools > Performance > Insights > Render blocking resources. Your primary goal is to identify and remove unnecessary render-blocking resources from the critical rendering path, by inlining critical resources, deferring non-critical resources, and removing anything unused.
Handling Cookie Banners and Pop-Ups Jump to heading
When dealing with cookie banners or pop-up elements, pay special attention to how they're implemented. These elements, typically displayed via JavaScript, can become problematic if they end up being the largest element in the viewport. When this happens, they become the LCP element and potentially delay the LCP value. A practical solution is to ensure these banners remain smaller than the main content elements in your viewport.

Optimizing Image-Related LCP Issues Jump to heading
For image-related LCP issues, several optimization strategies are available.
- Prioritize using
<img>or<picture>tags over CSS background images whenever possible. - In cases where you must use a CSS background-image, ensure you're preloading it in the
<head>section using a<link rel="preload">tag. - While lazyloading is an excellent performance technique, avoid applying it to LCP images – reserve it for images outside the viewport.
- Avoid using image transitions, as they often lead to performance degradation despite their visual appeal.
- If your LCP image is requested after non-critical resources, add a fetchpriority="high" attribute to prioritize its loading.

Enhancing Text-Based LCP Elements Jump to heading
For text-based LCP elements, focus on the following font delivery and rendering best practices:
- Minimize client-side rendering where possible, as it requires additional JavaScript processing before content display.
- Prefer system fonts when feasible, but if custom fonts are necessary, preload them in the
<head>using<link rel="preload">. - Always use
WOFF2format for optimal performance. - In some cases, your custom font might be slow to download, causing delays in rendering text-based content. In this scenario, use
font-display: swap;to show a fallback font until the custom font file has been downloaded. However, ensure you choose a fallback font that closely matches your custom font to prevent layout shifts – remember that significant differences between fallback and custom fonts can trigger CLS issues.

See it in action Jump to heading
Let's debug Largest Contentful Paint issues by analyzing CSS selectors in a real-world example with Shopify's Performance Reports.
Step 1: Access the LCP report Jump to heading
Navigate to the "Largest Contentful Paint: Page Type" report in your Shopify admin. You'll see a breakdown similar to this:

Step 2: Analyze CSS selectors Jump to heading
In the example above, the Index page is showing poor LCP scores. Let's dig deeper to identify which CSS selectors might be causing the slowdown.
To identify the specific CSS selectors affecting Index page:
- Under "Dimensions", select "Largest contentful paint target" instead of "Page type"
- Add a filter for "Page type" and set it to "Index"
- Add a filter for "Device type" and set it to "Mobile"
This will give you a detailed view of CSS selectors used for LCP elements, ordered by page load frequency:

In this example, there are two similar selectors showing poor LCP scores and impacts 15.1% of the page loads. With this crucial information, follow the described steps in this article to identify the LCP element and investigate what might be causing the slow performance.
Step 3: Find the LCP element using the CSS selector Jump to heading
Load the index (home) page, open Chrome DevTools and look for the CSS selector on the Elements panel:

In this case, our common LCP elements are images displayed in the main carousel.
Step 4: Analize common LCP issues Jump to heading
Now that we know what the LCP element is, we can check if it follows LCP optimization best practices. In this particular case, we see that the LCP image has a loading="lazy" attribute, and it's requested after critical resources. Hence, we can apply the following strategies and measure their impact:
- Remove the
loading="lazy"attribute from the first image in the carousel. - Add a
fetchpriority="high"attribute to prioritize image downloading.
 {% for block in section.blocks %}
  <div>
    <a
      href="{{ block.settings.link_to }}"
    >
      <img
        class="sc-link-slider__link-image-mobile ratio-{{ section.settings.ratio_mobile }}"
        src="{{ block.settings.image_mobile | image_url: width: image_width_mobile, height: image_height_mobile }}"
        alt="{{ block.settings.slider_text}}"
        width="{{image_width_mobile}}"
        height="{{image_height_mobile }}"
-       loading="lazy"
+       loading="{% if forloop.first %}eager{% else %}lazy{% endif %}"
+       {% if forloop.first %}fetchpriority="high"{% endif %}
      >
   </a>
 </div>
For more on LCP optimization and best practices, see our LCP articles on the blog.
Conclusion Jump to heading
In this article, we covered how to debug and fix the most common Largest Contentful Paint issues thanks to knowing the CSS selector of the LCP element. You can jump straight into fixing Cumulative Layout Shift (CLS) in Chapter 3, or review the fundamentals in Chapter 1.
Cover photo by Olga Deeva on Unsplash

